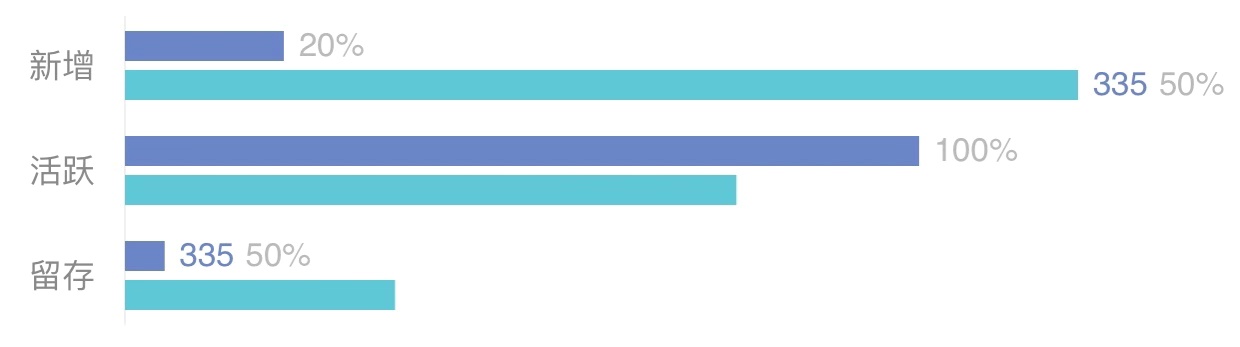
# 介绍

横向柱状图

# 示意图

# 代码示例

  1. 在wxml添加canvas
<canvas
    canvas-id="distribution"
    style="width: 414px; height: {{ totalHeight }}px;"
/>

TIP

分布图比较特殊,图表总高度不是一开始决定的,而是根据配置对数据计算之后才得到的,因此需要根据组件的totalHeight属性后置设置。

  1. 在js里面实例化组件
import DistributionChart from 'miniapp-charts';

Page({
    onLoad() {
        this.init();
    },
    init() {
        let chart = new DistributionChart(
            wx.createCanvasContext('distribution'),
            {
                width : 414,
                height: 200,
                debug : true,
            },
        );

        chart.initData({
            datasets: [
                {
                    name     : '行业',
                    fillColor: '#6684C7',
                    points: [
                        {
                            label: '新增',
                            value: 20,
                            barLabel: '20%',
                        },
                        {
                            label: '活跃',
                            value: 100,
                            barLabel: '100%',
                        },
                        {
                            label: '留存',
                            value: 5,
                            barLabel: [{
                                name: '335',
                                style: {
                                    color: '#6684C7',
                                }
                            }, '50%'],
                        },
                    ],
                },
                {
                    name: '行业',
                    fillColor: '#3AC6D5',
                    points: [
                        {
                            label: '新增',
                            value: 120,
                            barLabel: [{
                                name: '335',
                                style: {
                                    color: '#6684C7',
                                }
                            }, '50%'],
                        },
                        {
                            label: '活跃',
                            value: 77,
                        },
                        {
                            label: '留存',
                            value: 34,
                        },
                    ],
                }
            ]
        });

        this.setData({
            totalHeight: chart.totalHeight
        });

        chart.draw();
    },
}