# 介绍
雷达图是以从同一点开始的轴上表示的三个或更多个定量变量的二维图表的形式显示多变量数据的图形方法。
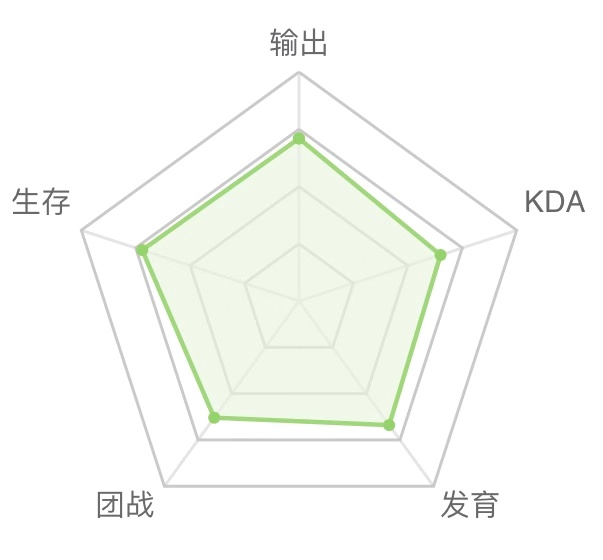
# 示意图
# 代码示例
- 在wxml添加canvas
<canvas
    canvas-id="radar"
    style="width:250px;height:250px;"
/>
- 在js里面实例化组件
import RadarChart from 'miniapp-charts/src/radar.js';
Page({
    onLoad() {
        let context = wx.createCanvasContext('radar');

        this.radarchart = new RadarChart(context,
            {
                width : 250,
                height: 250,
                padding: {
                    left: 5, right: 5, top:5, bottom: 5
                }
            }
        );

        this.radarchart.draw(
            {
                labels  : ['KDA', ['输出', 'KDA'],'KDA', 'KDA', 'KDA', '推进'],
                datasets: [
                    {
                        data: [50, 80, 75, 90,  67, 77],
                    },
                ]
            },
        );
    },
    bindtouchstart(e) {
        this.radarchart.touch(e);
    },
    bindtouchmove(e) {
        this.radarchart.touch(e);
    },
    bindtouchend(e) {
        this.radarchart.touchEnd(e);
    }
});