# 介绍
折线图组件用于绘制数据趋势图:
- 可以绘制一条或者多条曲线;
- 每条曲线的样式都可以独立配置;
- 最多支持左右两个坐标轴,每条曲线可以自由选择使用左右坐标轴;
- 几乎整个组件所有部分都可以配置;
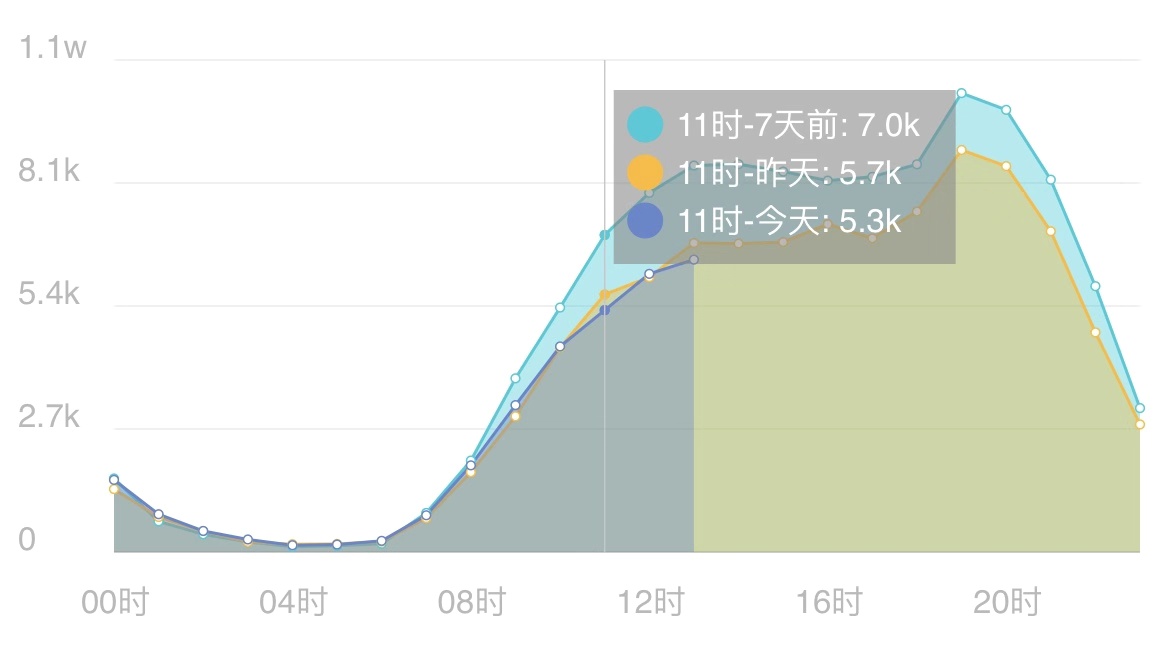
# 示意图
# 代码示例
- 在wxml添加canvas
<canvas
    canvas-id="linechart1"
    style="width:414px;height:200px;margin:0;position: absolute; left: 0; top: 0"
    bindtouchstart="bindtouchstart"
    bindtouchmove="bindtouchmove"
    bindtouchend="bindtouchend"
/>

<canvas
    canvas-id="linechart2"
    style="width:414px;height:200px;margin:0;position: absolute; left: 0; top: 0"
    bindtouchstart="bindtouchstart"
    bindtouchmove="bindtouchmove"
    bindtouchend="bindtouchend"
/>
- 在js里面实例化组件
import LineChart from 'miniapp-charts';

Page({
    onLoad() {
        this.init();
    },
    init() {
        let linechart = new LineChart(
            wx.createCanvasContext('linechart1'),
            {
                height: 200,
            },
            wx.createCanvasContext('linechart2'),
        );

        this.linechart = linechart;

        let points = [];
        for ( let i = 0; i < 108;i++) {
            points.push({
                x: i + 1,
                y: Math.ceil(Math.random()*30),
            });
        }

        linechart.draw({
            datasets: [
                {
                    points  : points,
                    lineName: 'test',
                },
            ]
        });
    },
    bindtouchstart(e) {
        this.linechart.touch(e);
    },
    bindtouchmove(e) {
        this.linechart.touch(e);
    },
    bindtouchend(e) {
        this.linechart.touchEnd(e);
    }
});